PostNL had an exceptional year in 2021, impacted by the pandemic. Thanks to our people and the resilience of our business, we produced strong results driven by a solid business performance at Parcels and a strong result at Mail in the Netherlands.
Total revenue amounted to €3,466 million and normalised EBIT was €308 million in 2021. Our cash flow performance was particularly strong, with free cash flow of €288 million, resulting in a further improvement of the company’s financial position.
The combination of the improved profitability and stronger financial position brought our leverage ratio, being adjusted net debt divided by adjusted EBITDA, to 0.4 in 2021, significantly below our target not to exceed 2.0.
Download spreadsheetYear ended at 31 December | 2020 | 2021 |
|---|---|---|
Revenue | 3,255 | 3,466 |
Normalised EBIT1 | 250 | 308 |
Free cash flow | 186 | 288 |
Adjusted net debt | 407 | 203 |
Leverage ratio | 1.0 | 0.4 |
Dividend (in €) | 0.28 | 0.42 |
In line with our capital allocation priorities, the increased EBIT and strong free cash flow allow us to invest in the growth of our business activities, including capacity expansion, investments related to achieve further cost savings, maintenance capex, investments in working capital and investments in the acceleration of our digital transformation and sustainability agenda.
Furthermore, PostNL’s financial strength and its capital allocation framework allows for a share buyback programme, which we announced at the beginning of 2022, with a total value of around €250 million. This reflects our confidence in the successful execution of our strategy and how comfortable we feel about our longer-term business performance and cash-generation perspective.
Our strong financial position and strong results also enables us to pay a 2021 dividend which, based on our dividend policy, we propose to be €0.42 per share (2020: €0.28).
We will continue to focus on value creation for all our stakeholders through growth opportunities, cost-saving initiatives, accelerating digitalisation, and our environmental and social plans.
PostNL applies the key performance indicators (KPIs) of revenue, normalised EBIT and free cash flow in its management analyses and reports on profitability performance. Normalised EBIT gives a reflection of the operating income performance, adjusted for the impact of project costs and incidentals. Free cash flow gives a reflection of the Group's ability to generate cash available for acquisitions, dividend distributions and/or debt repayments.
Normalised EBIT and free cash flow represent non-GAAP financial measures and should not be viewed in isolation as alternatives to the equivalent IFRS measures, which are presented in the consolidated financial statements, but should be used in conjunction with the most directly comparable IFRS measures. Non-GAAP financial measures do not have a standardised meaning under IFRS and therefore may not be comparable to similar measures presented by other issuers.
In 2021, revenue increased by 6.5% to €3,466 million (2020: €3,255 million), mainly driven by the acceleration of e-commerce growth within Parcels. At the same time, Mail in the Netherlands benefited from Covid-19-related items, such as vaccination invitations and self-tests, and a recovery within direct mail offerings. In 2021, 61% of our revenue was generated from e-commerce-related activities (2020: 57%).
Download spreadsheetRevenue | Normalised EBIT1 | |||
|---|---|---|---|---|
Year ended at 31 December | 2020 | 2021 | 20202 | 2021 |
Parcels | 2,052 | 2,361 | 209 | 230 |
Mail in the Netherlands | 1,708 | 1,683 | 96 | 160 |
PostNL Other | 108 | 200 | (55) | (81) |
Intercompany | (614) | (777) | ||
PostNL | 3,255 | 3,466 | 250 | 308 |
“PostNL had an exceptional year in 2021, driven by a strong business performance at both Parcels and Mail in the Netherlands”
In 2021, normalised EBIT amounted to €308 million (2020: €250 million, restated - refer to note 1.4 to the consolidated financial statements), of which around €82 million is estimated to be non-recurring and related to Covid-19 in 2021 (2020: €77 million, adjusted to include Spring and Logistics). The resulting margin, being normalised EBIT divided by total operating revenue, was 8.9% in 2021 (2020: 7.7%).
Compared to 2020, the increase of €58 million in normalised EBIT was driven by a solid business performance at Parcels and a strong result at Mail in the Netherlands, supported by additional Covid-19 volumes and some one-off effects. In 2020, integration costs of Sandd of €29 million were included in normalised EBIT (Mail in the Netherlands). Compared to 2020, normalised EBIT in 2021 includes around €(20) million higher non-cash pension expenses (PostNL Other).
Normalised EBIT excludes exceptional items, which amounted to €15 million in 2021 (2020: €49 million). Further information on the bridge from operating income to normalised EBIT is included in note 2.5 Segment information to the consolidated financial statements.
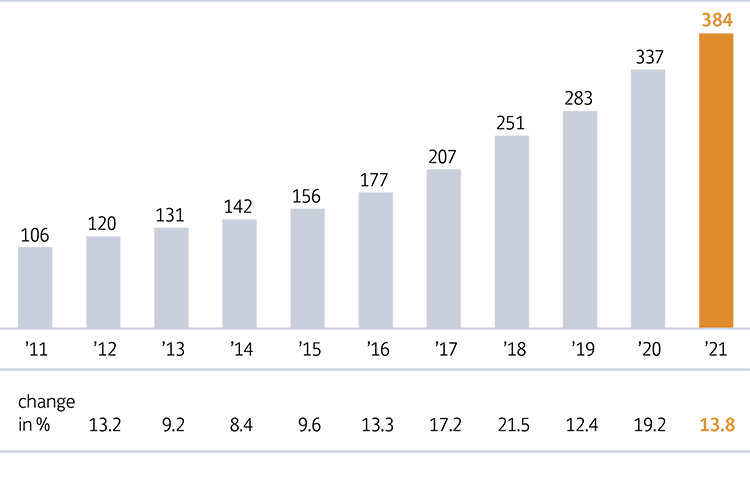
In 2021, we delivered a record 384 million parcels, of which we estimate around 38 million to be non-recurring and related to Covid-19 (2020: 28 million). This resulted in volume growth of 13.8% (2020: 19.2%). If we exclude the non-recurring volumes related to Covid-19, volumes increased by 11.7% compared to 2020. These positive figures reflect the ongoing growth in e-commerce. Our flexible infrastructure and excellent peak season preparations prove the robustness of our business model in the Netherlands. International volumes also increased, predominantly visible in the first half year and supported by additional Covid-19 volumes. In the second half, volumes from Asia declined by 50%-60% due to the VAT regulation that came into effect on 1 July 2021, tightened regulations in China targeting fake goods, significantly increased freight costs and disruptions in the global supply chain.
 |
Revenue at Parcels grew strongly to €2,361 million (2020: €2,052 million), mainly driven by the strong volume growth, additional Covid-19 volumes, and higher tariffs partly offset by negative mix effects.
Normalised EBIT increased by €21 million, from €209 million in 2020 to €230 million in 2021, driven by a 13.8% volume increase. The volume growth resulted in €204 million additional revenues, partly offset by a negative price/mix effect of €12 million and higher volume dependent costs of €122 million, and impacted normalised EBIT positively by €70 million.
Organic costs increased by €22 million due to collective labour agreement increases, indexation of delivery partners and higher fuel costs. Other costs increased by €50 million, caused by a variety of factors such as network expansion costs, additional costs related to the December end-of-year period, additional Covid-19-related costs, higher retail lock-down fees, higher costs for IT and the acceleration of digitalisation.
The other results were up €23 million, thanks to higher overall results at Spring Europe and Logistics, driven by top-line growth benefitting from e-commerce, partly offset by lower international results from Asia volumes.

Digital Next is a company-wide programme to accelerate the digitalisation of our core business model and enable innovative digital business opportunities. In 2021 we invested around €18 million in priority Digital Next initiatives, from strengthening our IT and data processes, placing digital beacons on our 290,000 roll containers, enabling a truly digital supply chain, building digital channels, exploring new digital business models, to simplifying and digitalising our customer journeys.
These additional investments will help us improve the quality and efficiency of our services, as well as realise cost savings across the company through smarter digital processes. They will also contribute to delivering a distinctive customer experience and increasing customer loyalty, measured through Net Promoter Score (NPS). The Digital Next programme is expected to become accretive to ROIC as of 2023.

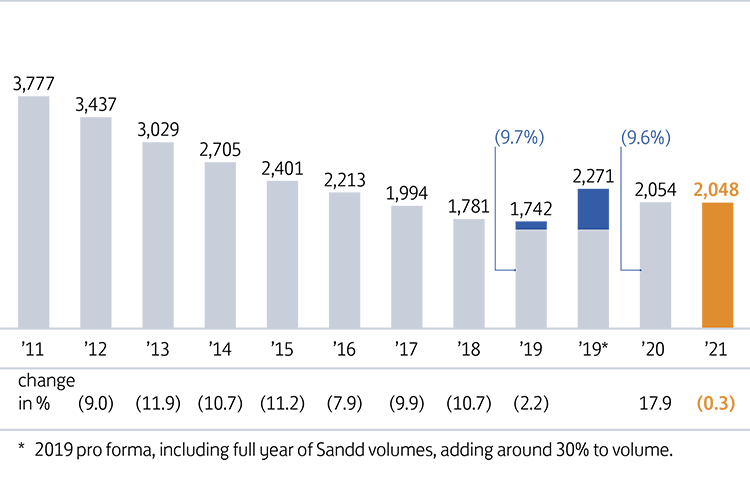
In 2021, performance at Mail in the Netherlands was marked by a further decline in volumes due to substitution, partly offset by additional Covid-19 volumes and the positive impact of elections and working days. In total, we delivered 2,048 million items of mail in 2021 of which 70 million items were assumed to be non-recurring volumes related to Covid-19 (2020: 15 million).
 |
In 2021, the reported volume decline was limited to 0.3% (2020: 9.6%, compared with the pro-forma full year 2019 volumes of Sandd). The underlying volume decline as a result of substitution was around 5% in 2021.
Revenue at Mail in the Netherlands was down 1.5% to €1,683 million (2020: €1,708 million). The negative volume impact of €5 million was more than offset by a positive price/mix effect of €50 million. The limited volume effect was driven by additional Covid-19 volumes, whilst the price/mix effect was mainly due to higher tariffs and an increase in letterbox packages. The net positive volume price/mix effect was more than offset by the revenue lost following the sale of Adeptiv and Cendris.
Normalised EBIT significantly increased by €64 million to €160 million (2020: €96 million). The net volume price/mix effect of €45 million was partly offset by higher volume-dependent costs of €14 million. Organic costs were up €19 million mainly due to collective labour agreement increases and inflation.
Other costs decreased by €69 million, which largely can be explained by additional cost savings and efficiency improvements of €26 million and specific non-recurring effects, such as the integration costs of Sandd of €29 million in 2020. Other results were down €17 million, mainly influenced by lower export volumes.
PostNL continues to implement cost saving initiatives, such as adjustments to the sorting and delivery process, streamlining of staff and centralising of locations.
Revenue at PostNL Other in 2021 amounted to €200 million (2020: €108 million). This revenue is mainly intercompany revenue related to IT. Normalised EBIT decreased to €(81) million (2020: €(55) million), mainly due to higher non-cash pension expenses of around €20 million, as indicated earlier, the accounting impact of which is reversed in other comprehensive income.
In 2021, pension expenses amounted to €161 million (2020: €145 million) and total cash contributions were €108 million (2020: €311 million) or €92 million excluding the first instalment of €16 million of the unconditional funding obligation of €80 million (2020: €111 million, excluding the settlement payment of €200 million).
On 31 December 2021, the pension fund’s actual coverage ratio was 126.2% (2020: 111.1%). The fund’s 12-month average coverage ratio was 121.4% (2020: 104.4%), above the minimum required funding level of around 104.0%. The remaining part of the unconditional funding obligation of €64 million at 31 December 2021 will be paid in four instalments during the years 2022 – 2025.
For further details on pensions, see note 3.5 Provisions for pension liabilities to the consolidated financial statements.
In 2021, the result from discontinued operations was €29 million (2020: €4 million). On 29 January 2021, PostNL and Mutares closed the sale of Nexive to Poste Italiane, whereby PostNL divested its retained minority interest of 20% in the entity acquiring the Nexive business. PostNL also terminated the joint venture agreement with Mutares, which resulted in the release of the remaining part of the related committed cash contributions. The transaction resulted in a net result of €24 million (including final settlement) and cash proceeds of €27 million. For further details on our discontinued operations, see note 3.9 Assets classified as held for sale to the consolidated financial statements.
Download spreadsheetYear ended at 31 December | 2020 | 2021 |
|---|---|---|
Revenue | 3,255 | 3,466 |
Operating income | 298 | 324 |
Profit for the period | 216 | 258 |
Profit from continuing operations | 213 | 228 |
Total comprehensive income | 240 | 325 |
Free cash flow | 186 | 288 |
Return on invested capital | 17.6% | 16.4% |
Adjusted net debt | 407 | 203 |
Consolidated equity | 211 | 426 |
Free cash flow is defined as cash flow before dividend, acquisitions, redemptions of bonds and other financing activities and after payment of leases. The repayments of leases and related cash flows, reported as cash used in financing activities following the adoption of IFRS 16, are as such included in our calculation of free cash flow.
Our free cash flow performance improved by €102 million to €288 million in 2021 (2020: €186 million). Our strong business performance, favourable working capital development, lower regular pension and provision cash out and the proceeds from the sale of Cendris were only partly offset by higher capital expenditures and increased income taxes paid.
In 2021, cash flow included the payment of the first of five annual pension installments of €16 million. In 2020, cash flow included the net proceeds of the sale-and-leaseback transaction of €148 million and the settlement payment of €200 million related to the transitional plans.
Our aim is to generate a positive spread of the return on invested capital (ROIC) over the post-tax WACC (7.5% for the Group). PostNL defines ROIC as net operating profit less adjusted tax (NOPLAT) divided by invested capital. At the end of 2021, the ROIC for the Group was 16.4% (2020: 17.6%). The positive spread over the WACC in 2021 was +890 bps, which reflects our exceptional performance in 2021.
Download spreadsheetYear ended at 31 December | 2020 | 2021 |
|---|---|---|
Operating income | 298 | 324 |
Less adjusted tax | (75) | (81) |
Net operating profit less adjusted tax (NOPLAT) | 224 | 243 |
Total equity | 213 | 429 |
Adjusted net debt | 407 | 203 |
Add back cash and cash equivalents | 651 | 848 |
Invested capital | 1,271 | 1,480 |
Return on invested capital (ROIC) | 17.6% | 16.4% |
The favourable effect of the non-recurring impact of Covid-19 in 2021 largely explains the exceptional ROIC in 2021. However, if adjusted for large incidental and non-recurring effects, we would still see a positive spread over the WACC.
The decrease of the ROIC compared to 2020 is explained by an increased level of invested capital due to higher equity, partly offset by underlying improved business performance (reflected by the increase in normalised EBIT) and the above-mentioned positive incidentals.
At the end of 2021, our adjusted net debt position amounted to €203 million (2020: €407 million). The improvement of €204 million was mainly fuelled by our strong performance on adjusted free cash flow. Reference is made to note 4.1 to the consolidated financial statements for further details on the development of our adjusted net debt position.
Download spreadsheetAt 31 December | 2020 | 2021 |
|---|---|---|
Short- and long-term debt | 708 | 732 |
Long-term interest bearing assets | (27) | (20) |
Cash and cash equivalents | (651) | (848) |
Net debt | 31 | (136) |
Pension liabilities | 86 | 67 |
Lease liabilities (on balance) | 294 | 333 |
Lease liabilities (off balance)1 | 66 | 17 |
Deferred tax assets on pension and lease liabilities2 | (70) | (79) |
Adjusted net debt | 407 | 203 |
The combination of our step-up in profitability and better financial position benefited our leverage ratio, being adjusted net debt divided by adjusted EBITDA, which improved further from 1.0 in 2020 to 0.4 in 2021, both significantly below our target not to exceed 2.0.
Download spreadsheetYear ended at 31 December | 2020 | 2021 |
|---|---|---|
Adjusted net debt | 407 | 203 |
Operating income | 298 | 324 |
Depreciation, amortisation and impairments | 164 | 149 |
Proxy for short-term leases and leases of low-value assets | 4 | 4 |
Normalisations on EBIT | (49) | (15) |
Reversal of normalised depreciation, amortisation and impairments1 | (17) | (0) |
Adjusted EBITDA | 400 | 461 |
Leverage ratio | 1.0 | 0.4 |
Total equity attributable to equity holders of the parent company increased to €426 million at 31 December 2021 (2020: €211 million; restated - refer to note 1.4 to the consolidated financial statements).
The increase of €215 million in 2021 is mainly explained by the profit for the year of €258 million (2020: €216 million) and a €54 million positive impact from pensions, net of tax, recorded within other comprehensive income, offset by dividend paid of €113 million. The increase in net income from €216 million in 2020 to €258 million in 2021 includes a €16 million higher result from continuing operations and a €26 million higher result from discontinued operations.
At year-end 2021, PostNL's cash and cash equivalents amounted to €848 million (2020: €651 million) with current assets exceeding current liabilities.
PostNL has entered into a €200 million revolving credit facility. This facility replaces the previous €400 million multicurrency revolving credit facility. With the facility, PostNL secures the availability of future financing at updated terms and lower costs, in line with its financial policy. PostNL wants to be the driver of sustainable logistics in the Benelux. Therefore, the margin PostNL pays is partly dependent on the successful execution of its emission-reduction strategy.
PostNL has no material refinancing of short-term credit facilities or other debt. There are no financial covenants. Our latest S&P credit rating is BBB+ with stable outlook. This underpins the solid financial performance and position of our company.