2.2 Climate change
In this section, we provide disclosures on our material impacts, risks, and opportunities relating to climate change. At PostNL, we recognise that addressing climate change is essential to our long-term success while maintaining our commitment to responsible business practices. We are dedicated to reducing our environmental impact through measures such as our transition plan and environmental policy. This section outlines our approach to managing climate-related challenges.
2.2.1 Our strategy
With the help of our Double materiality assessment, we assessed and identified the most material sustainability matters. For further information on how our material topics relate to our value chain, please see Our value chain and material topics section within the General disclosures.


Identifying our most material impacts helps us to prioritise our actions to prevent and mitigate identified sustainability matters. For climate change, we identified (potential) material impacts, risks or opportunities on the following topics:
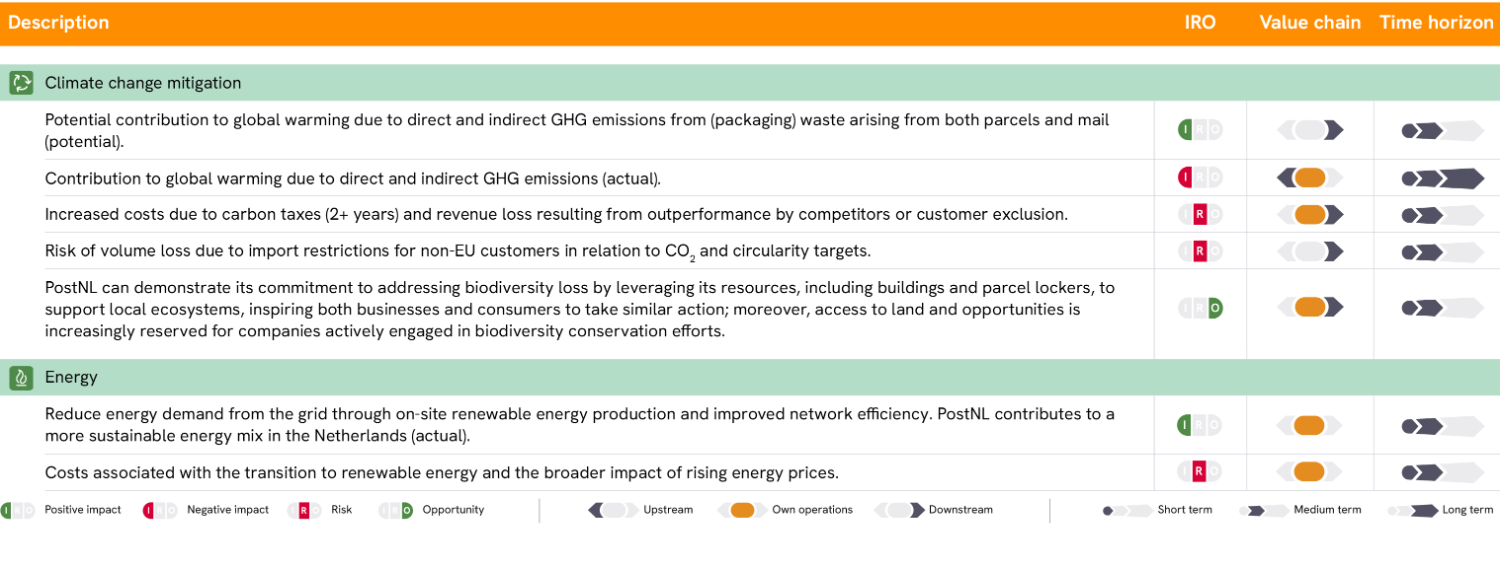
- Climate change mitigation
- Energy
More on how we address these material topics can be found in Our policies and in Our performance later in this Climate change section.
Climate risk analysis
At PostNL, we conduct climate-related scenario analysis to identify and assess both physical and transition risks across short-, medium-, and long-term horizons. This analysis aligns with the 1.5°C and 2°C pathways outlined in the Paris Agreement to explore transition risks, while physical risks are assessed based on higher emission scenarios, including Network for Greening the Financial System (NGFS) 3°, reflecting more severe warming scenarios. These approaches ensure that we address a wide range of plausible risks and uncertainties.
Scenario analysis framework
Our resilience analysis incorporates climate-related scenario analysis, allowing us to evaluate risks and opportunities. Our scenario analysis integrates localised geospatial data and macro-level trends. This allows us to assess physical risks with precision, such as evaluating critical infrastructure against extreme weather or flooding, while simultaneously accounting for national policy changes and energy market shifts. The scenarios also provide insights into opportunities, such as fleet electrification and biofuel adoption, ensuring our strategy aligns with global and regional climate trajectories.
Use of climate scenarios
Our climate scenario analysis employs models aligned with the Paris Agreement, including the IEA’s Net Zero Emissions by 2050 scenario and NGFS climate pathways for transition risks, and higher-emission RCP 4.5 and RCP 8.5 scenarios for physical risks. By examining diverse global warming scenarios, we assess how varying trajectories could impact our operations and long-term strategy. Specifically:
- Transition risks: Assessed using 1.5°C and 2°C pathways (e.g., IEA’s Net Zero Emissions by 2050).
- Physical risks: Evaluated using high-emission scenarios (e.g., RCP 4.5 and RCP 8.5), which reflect more acute physical impacts.
Time horizons
- Short term: one year or less, 2025
- Medium term: two to five years, 2026-2030
- Long term: over 5 years, 2031 and later.
Critical assumptions
Our analysis is built on the following assumptions about the transition to a low-carbon, resilient economy:
- Macroeconomic trends: We expect rising carbon prices, shifting trade patterns, and stronger incentives for renewable energy.
- Energy consumption and mix: A gradual shift from fossil fuels to renewables, particularly solar and wind. For PostNL, this means fleet electrification and renewable-powered facilities.
- Technological deployment: Advancements in sustainable transport, battery efficiency, and biofuels will drive industry change.
Four-step climate risk assessment
Our climate risk assessment process, embedded within our Enterprise Risk Management (ERM) framework, follows these four key steps:
- Risk long-list identification: Defining a comprehensive list of potential risks, including chronic and acute climate impacts.
- Structured assessment: Internal specialists evaluate the likelihood and severity of risks through workshops and voting. The magnitude and likelihood of risks are assessed based on their potential financial and operational impacts, as well as the exposure of assets and business activities to transition events.
- Executive review: The EC prioritises climate risks within the broader business risk portfolio.
- Action plan development: We develop targeted initiatives to bridge gaps between risk exposure and risk appetite, focusing on fleet electrification and renewable energy investments.
This iterative process ensures our strategy adapts to new data, regulatory changes, and technological advancements, enabling informed decisions to reduce GHG emissions and mitigate adverse impacts. No significant physical and regulatory climate change-related risks were identified during 2024.
Results of the analysis
- Physical risksChronic risks: Long-term risks like temperature rise and sea level change are unlikely to affect operations before 2050.Acute risks: Storms and flooding may cause temporary disruptions, mitigated through business continuity plans and geospatial analysis. Financial planning accounts for disruption costs and resilience measures, which will evolve with new data.
- Transition risks
Two key climate-related transition risks were identified, both driven by regulations and shifting preferences:1. Financial impact: Higher costs from carbon taxes (2+ years) and potential revenue loss due to competitor outperformance or customer exclusion.2. Volume loss: Import restrictions for non-EU customers linked to CO2 and circularity targets may affect demand.The resilience analysis highlights that these risks require strategic adaptation in the short-, medium-, and long-term. In the short term (to 2030), PostNL will prioritise the decarbonisation of its fleet through electrification and adoption of renewable fuels. Beyond 2030, we aim to integrate circular business models into our processes and value chain to further enhance sustainability. - Scenario insights
Paris-aligned scenarios (e.g., IEA Net Zero 2050, NGFS pathways) highlight regulatory, economic, and technological shifts. High-emission scenarios (RCP 4.5, RCP 8.5) inform physical risk analysis, focusing on extreme weather impacts.
Identifying assets and activities incompatible with a climate-neutral economy
PostNL has not identified any assets or business activities that are incompatible with a transition to a climate-neutral economy or that require significant efforts to achieve compatibility (e.g., due to locked-in GHG emissions or Taxonomy-alignment challenges).
Evaluating GHG emission sources
To identify current and future sources of GHG emissions, we screen our operations and value chain comprehensively, covering:
- Scope 1 (direct emissions): e.g., fuel combustion
- Scope 2 (indirect emissions): e.g., purchased electricity and district heating
- Scope 3 (value chain emissions): e.g., third-party logistics, employee commuting, and production of goods/services.
We also analyse future emissions by assessing business growth, supply chain shifts, operational changes, and climate-related impacts like land-use changes and black carbon. This long-term approach anticipates emissions changes over time and ensures alignment with strategic goals.
Exclusions from the analysis
While our analysis is comprehensive, it excludes certain indirect or less material impacts. For example, specific upstream supply chain emissions (scope 3, purchased goods and services) are not yet fully assessed due to data limitations. These exclusions will be revisited in future analyses and disclosed in subsequent annual reports as data availability improves.
Areas of uncertainty
The resilience analysis identifies key areas of uncertainty:
- Physical risks: Potential hotspots for flooding or extreme weather remain a focus for ongoing evaluation, using geospatial data for critical infrastructure.
- Transition risks: Uncertainty around the pace of regulatory changes, societal preferences, and technological advancements could impact future planning.
These uncertainties are addressed through flexible action plans, ensuring that strategy and investment decisions can adapt to emerging risks. Current and planned mitigation actions, such as fleet electrification and infrastructure upgrades, align with PostNL’s broader strategy to minimise exposure to these risks.
Financial effects and mitigation actions
- Anticipated financial effects
- Physical risks are expected to have limited financial impacts due to robust mitigation measures, such as geospatial risk assessments and operational redundancy plans.
- Transition risks include investments in fleet electrification, renewable energy sourcing, and compliance with regulatory changes. These costs are integrated into our financial planning cycles.
- Mitigation actions
- Fleet decarbonisation: Accelerated adoption of electric vehicles and biofuels.
- Renewable energy: Transitioning facilities to solar and wind energy.
- Stakeholder engagement: Ongoing collaboration with regulators, suppliers, and customers to align strategies with evolving requirements.
Conclusion
Our climate-related scenario enables us to remain resilient against both physical and transition risks. By integrating geospatial data, regulatory frameworks, and technological insights, we position ourselves to mitigate risks and capitalise on opportunities in a low-carbon, climate-resilient future. Ongoing assessments and adaptive strategies will ensure that our operations remain aligned with global sustainability trajectories.
Transition plan
In our approach to sustainability, climate change, liveability, and circularity are inseparable. This means that each initiative within our transition plan is designed to address these three key-material themes holistically. For example, by electrifying our fleet and using renewable fuels, we reduce CO₂e emissions and lessen our negative impact on air quality. At the same time, investments in reusable packaging not only reduce waste but also contribute to lower carbon emissions in the supply chain.
Linking these themes ensures that our sustainability efforts are comprehensive and address the broader environmental challenges we face as a society. This holistic approach ensures measurable, transparent progress, guided by science-based targets and supported by ongoing investments in cleaner technologies. Below we describe how we focus on these themes and the key actions taken within our transition plan to address them. These actions are explained in detail later in this section.
Climate change: Net zero by 2040
We are committed to cutting carbon emissions in line with the Science Based Targets initiative (SBTi) and the Paris Agreement, aiming for net-zero by 2040 with a maximum of 10% of our carbon emissions remaining. To achieve this, we are committed to reducing our CO₂e emissions scope 1 and 2 by 90% and scope 3 by 45% in 2030 compared to our base year 2021. Additionally we will reduce all scope 1,2 and 3 CO2e emissions by 90% in 2040 compared to our base year 2021 (the base year is related to our SBTi target submission, which stipulates that it must be within two years of the submission date. In our case, this was 2023). These gross targets span scopes 1, 2, and 3, covering both our direct emissions (from our own operations and energy use) and indirect emissions (from our value chain).
Key actions within our transition plan include:
- Energy-efficient infrastructure: We are building energy-efficient sorting centres, installing solar panels, and transitioning to an all-electric vehicle fleet.
- Renewable fuels: Using biogas and HVO100 for non-electric vehicles, cutting emissions by up to 90% compared to conventional fuel.
- Efficient transport operations: Optimising routes, reducing kilometres, and integrating return logistics to minimise CO₂e emissions.
Liveability: Reduce air pollution and minimise congestion
Beyond reducing carbon emissions, we focus on cutting air pollution to improve urban liveability. By 2030, we aim for emission-free delivery in the last-mile (i.e. from the final sorting centre to the consumer or an alternative pick-up point), reducing CO2e, NOx, and particulate matter from the combustion engines. We are making progress through:
- Zero-emission vehicles – Deploying light electric freight vehicles (LEFVs) for cleaner, quieter cities.
- Alternative delivery points – Expanding PostNL points and parcel lockers to cut delivery kilometres and emissions in urban areas.
- Biodiversity integration – Implementing green roofs, insect hotels, and nesting boxes at facilities to support local ecosystems.
Circularity: Towards zero waste by 2040
We aim for zero waste by 2040, focusing on the circular use of materials in our processes. We are making progress through:
- Extending equipment lifespan – Replacing cargo bike parts instead of full replacements.
- Reusable packaging – Partnering to reduce single-use cardboard.
- Reusable pallet boxes – Cutting daily single-use plastic wrap in international sorting centres.
- Circular procurement – Sourcing recycled or sustainably produced materials, with suppliers adhering to international climate, biodiversity, and waste guidelines.
In our sustainability approach, climate, liveability, and circularity are interconnected. Each initiative in our transition plan addresses these themes holistically—for example, fleet electrification cuts CO2e and improves air quality, while reusable packaging reduces waste and emissions. Our progress is measurable and science-based.
Decarbonisation levers
By utilising decarbonisation levers, PostNL cannot only reduce its carbon footprint but also comply with stricter regulations and meet the growing demand for sustainable logistics solutions from customers and partners. The table below shows our identified decarbonisation levers.
PostNL Decarbonisation levers
Decarbonisation lever | Details | Scope |
|---|---|---|
Climate change - Energy | ||
| Electrification of our fleet | Switching to electric vehicles and sustainable infrastructure will significantly cut direct CO2e emissions from our transport activities. This is key to achieving emission-free delivery of all parcels and letters in the last-mile in the Benelux by 2030 and become net zero by 2040. |
|
| Renewable fuels | Utilising biofuels, hydrogen, or synthetic fuels instead of fossil fuels for trucks, achieving lower CO2e emissions per unit of energy compared to traditional diesel. |
|
| Network efficiency | We optimise operations to reduce kilometres, costs, and emissions. This includes collaborating across the value chain, bundling deliveries, minimising packaging air, and expanding automated parcel lockers and PostNL locations. |
|
| Sustainable infrastructure | We develop and renovate sites that are BREEAM-certified across the Benelux, meeting legal and regulatory standards, including Natura 2000 protection. |
|
| Energy efficiency | We are committed to procuring 100% renewable energy and reduce our energy consumption at our facilities, such as solar panels on our sorting centre roofs, generating 50% of the electricity they consume. |
|
Circular economy - Sustainable procurement | ||
| Reduce material in operations | We follow the 10R circularity ladder, aiming for long product lifespan, minimal waste, and product reuse. Together with suppliers, we want to develop a roadmap for circular business models. |
|
Circular economy - Waste management | ||
| Reduce residual waste | Installing collection devices to separate waste and make it accessible to workers in our sorting locations and offices. |
|
Circular economy - Sustainable products and services | ||
| Enabling circular business models | We help businesses adopt circular economy principles through specialised logistics for reverse logistics, repair, reuse, and recycling. We also support e-waste and clothing collection for repair, donation, and recycling, reinforcing our commitment to sustainability. | |
Investments and funding of the transition plan
Our sustainability actions depend on financial resources, ensuring we meet climate targets while balancing financial feasibility. The current financial pressures mean that we need to carefully balance our sustainability ambitions with financial feasibility, ensuring that we make the most effective use of available resources while staying committed to our long-term climate goals. We align our environmental and financial strategic plans to fund emission-reduction initiatives. Achieving emission-free last-mile delivery by 2030 requires significant investment in infrastructure, vehicles, power supply, and delivery partner engagement. In 2021, PostNL announced that we would invest around €80 million in climate-related investments during 2022-2024. This investment has been used to support fleet electrification and sustainable fuels. We recognise that our financial performance impacts the available capital for future investments.
While these investments are key to our Climate Transition Plan, its financing is not directly linked to activities under the EU Taxonomy or investments in the financial statements. For example, investments in fleet electrification—such as leasing electric vehicles— classify as CapEx under the EU Taxonomy and new leases in the financial statements, while the climate investments are based on lease payments. An overview of payments related to climate investments can be found in our Green Bond Report, which provides transparency on how we allocate funds to support sustainable initiatives.
Green Bond
Our Green Bond programme funds climate-related initiatives, including emission-free logistics and innovative technologies, supporting our commitment to SDG 8 (Decent Work & Economic Growth) and SDG 13 (Climate Action). It is a key enabler, which broadens our investor base and accelerates our sustainability journey.
Since 2019, we have invested €237 million, as detailed in our 2023 Green Bond Report published on our website:
- €44 million in clean transportation – Fully electric vehicles, our first electric truck, and a fast-charging station in Nieuwegein.
- €191 million in sustainable buildings & energy efficiency – 28 sustainable buildings, including solar panels and heat pump installations.
- €2 million in renewable energy innovation – Battery installations to optimise solar energy use.
Locked-in GHG emissions
Based on the expertise of our internal, logistic sustainability experts, we have assessed potential locked-in GHG emissions from our key assets and products, which include a dependency on both progress in reducing emissions within our supply chain and technological advancements, particularly in zero-emission long-haul transport. The most significant transition risk we have identified is related to air transport, the hardest sector to decarbonise. We are exploring Sustainable Aviation Fuel (SAF), which cuts GHG emissions by 50–80% over its lifecycle but remains costly and not fully emission-free, limiting short-term scalability. An EFRAG survey suggests that most conventional assets in the postal sector could be decarbonised through alternative fuels, reducing the risk of long-term emissions lock-in.
EU Taxonomy
PostNL reports on the EU Taxonomy but has no specific plan or objective to increase alignment. Our decarbonisation efforts focus on fleet electrification. Although we do invest in electric vehicles (cars, vans and trucks) alignment will not be achieved due to the tire-requirements of the EU-taxonomy criteria. PostNL expects its alignment with the provisions of Commission Delegated Regulation (EU) 2021/2139 to evolve over time, including the consideration of key performance indicators, such as taxonomy-aligned revenue, capex, and capex plans, as required by Article 8 of Regulation (EU) 2020/852. However, the activities that are currently aligned with the EU Taxonomy are not part of our ongoing transition plan, as they already meet the sustainability criteria set out in the regulation. PostNL is not excluded from the EU Paris-aligned, and reports in alignment of the EU Paris-aligned Benchmarks.
Relation with strategic plan
PostNL’s transition plan is fully integrated into our planning and control cycle, embedding sustainability in decision-making. This supports effective capital allocation, risk management, and progress tracking, ensuring climate goals align with core operations and strategy. Reducing GHG emissions is central, including emission-free last-mile delivery by 2030 and alignment with national and EU policies. We invest in fleet electrification, renewable energy, and logistics optimisation. Performance indicators track progress, identifying risks and opportunities in a dynamic environment. The transition plan stems from our strategic plan, approved by the EC, with science-based targets validated by the BoM.
Progress
The progress of the transition plan is monitored through our strategic planning process and reported on in our annual report. Quantitative and qualitative progress of our transition plan can be found in the Our performance section later in this chapter.
2.2.2 Our governance
For more information on how climate-related considerations are factored into the remuneration of our BoM, please see pages 144-154 in the Remuneration report chapter.
2.2.3 Our policies
PostNL has the following policies in place to prevent, mitigate and remediate actual and potential impacts, to address risks and to pursue opportunities.
- Our environmental policy explains how we address our impacts, risks and opportunities.
- Our procurement policy defines the standards we expect from our suppliers, requiring them to uphold ethical, legal, and social responsibilities as a minimum. In addition, we expect suppliers to operate sustainably and to comply with applicable local and international laws and regulations. The policy is built on our business principles and provides a clear, comprehensive framework for suppliers and subcontractors to follow. For more information on procurement, see Procurement policy later in the environmental disclosures.
Environmental policy
Our environmental policy defines the strategies and key actions we have implemented to prevent, mitigate, and remediate actual and potential environmental impacts. It addresses risks and capitalises on opportunities related to climate change mitigation, energy efficiency, pollution reduction, and the circular economy. PostNL is committed to reducing its environmental footprint by transitioning to emission-free logistics and maximising the use of renewable energy across its operations, supporting our goal of reaching net zero by 2040. This reflects our ambition to position the company as a leader in sustainable logistics, drive circular economy principles, and contribute to biodiversity conservation.
How our policy addresses climate related IROs
Our primary focus is on combatting climate change by significantly reducing our carbon emissions, and have aligned targets with the SBTi and the Paris Agreement, which aim to limit global warming to 1.5°C. More information on our alignment with SBTi targets can be found in Our performance later in this section.
Climate change mitigation
PostNL’s policies take a comprehensive approach to addressing climate change, focusing on managing greenhouse gas (GHG) emissions, removals, and transition risks across various time horizons within our operations and throughout our upstream and downstream value chain. Our commitment to achieving net-zero carbon emissions by 2040 aligns with the Science Based Targets initiative (SBTi) and the Paris Agreement’s 1.5°C objective. To this end, we are targeting a 90% scope 1 and 2 and 45% scope 3 reduction in gross CO2e emissions by 2030 and a 90% reduction in scope 1, 2 and 3 emissions by 2040, from a 2021 baseline.
Short term (2025–2030)
In the short term, our strategy focuses on cutting GHG emissions through fleet electrification, renewable fuels, and energy efficiency in buildings and logistics. These measures mitigate risks like carbon taxation and competition while driving innovation and operational improvements.
Medium term (2030–2040)
By 2040, we target a 90% emissions reduction, with an emphasis on decarbonisation across scopes 1, 2, and 3. Key initiatives include expanding renewable energy, sustainable procurement, and waste reduction to achieve our zero waste target by 2040. Collaboration with partners and suppliers is essential to managing risks and driving sustainability.
Long term (beyond 2040)
Our net-zero commitment encompasses addressing residual emissions through robust GHG removal strategies. This involves utilizing advanced carbon sequestration techniques to permanently neutralize any remaining emissions, ensuring that no more than 10% of emissions persist before removal. PostNL is committed to positioning itself as a leader in sustainable logistics, driving circular economy principles, and supporting biodiversity conservation.
Energy efficiency
PostNL’s policies prioritise energy efficiency across our operations. We focus on improving the energy use of our buildings and fleet, with progress measured through both absolute and relative GHG emissions.
Renewable energy deployment
PostNL is committed to expanding renewable energy use, focusing on our logistics network. While financial factors may affect the pace, we prioritise sustainable sourcing and cleaner energy to support our net-zero goals.
Waste management
PostNL’s waste management policy supports our circularity strategy, targeting net zero residual waste by 2040. Aligned with the waste hierarchy, we prioritise waste avoidance through smart logistics, digitalisation, and packaging optimisation, followed by reuse initiatives and maximising recycling. Our goal is a 90% reduction in residual waste, ensuring no more than 10% is non-recyclable or cannot be repurposed. Governance is managed by group company management and head office directors, with progress tracked through key indicators and aligned with national and international policy goals.
Scope
PostNL’s environmental policy applies to all group companies and their value chain activities. It affects employees, customers, consumers, and society, with relevant targets shared via business partners. All group policies are on our internal site, while the environmental policy is publicly available. The ESG director, mandated by the BoM, oversees implementation.
Monitoring
Because we implemented our environmental policy in 2024, no updates are expected in 2025. The policy is monitored and discussed on a quarterly and annual basis by the relevant teams and their management and with the BoM.
PostNL monitors progress of its climate change mitigation strategy by:
- Measuring absolute GHG emissions in metric tonnes of CO2e (scope 1, 2 and 3)
- Measuring relative GHG emissions in metric grammes of CO2e per transported kilometre of its own operations
- Measuring the environmental impact of its last-mile logistics activities
- Measuring absolute and relative changes in energy use for buildings and fleet
- Reporting on the energy use, both absolute and relative in total and broken down, for its buildings and fleet
- Measuring the percentage of residual waste from own operations.
PostNL uses the GHG protocol to calculate and report its environmental performance metrics.
2.2.4 Our performance
Mitigation of climate change as well as reducing our energy usage are key elements of our transition plan, aligned with our strategic objective to minimise environmental impact. We aim to realise this by, for example, electrifying our fleet and optimising our network efficiency.
Climate change mitigation
Actions
In 2024, we set key actions to advance decarbonisation, focusing on reducing GHG emissions and supporting the circular economy. For each action, we disclose allocated resources, progress, and expected outcomes in line with our policies. The table outlines scope, timing, and impacted stakeholders.
Electrification of our fleet
PostNL is committed to emissions-free logistics, fossil-fuel vehicles are being replaced with electric alternatives, prioritising last-mile delivery. By the end of 2024, 46% of our own fleet was electric, aiming for full last-mile electrification by 2030.
Key actions in 2024
- Added 330 e-vehicles to our network, slightly below target due to supplier delays.
- Installed 164 charging stations despite grid congestion challenges.
- Implemented a dynamic, algorithmic charging schedule across our Dutch operations, with potential expansion to TGN.
- 8% of delivery partner kilometres now emission-free, supported by 300 new e-vehicles.
- New routes assigned only to delivery partners using electric vehicles, with financial support for cost differences.
- Enhanced licence plate registration for better data accuracy, feeding into the zero-emission dashboard and sustainability reporting.
Investments support by the Green Bond
- €17.15 million in fleet electrification capex, €44 million in clean transport, and investments in electric vehicles including an electric large truck.
- Fast-charging station installed at Nieuwegein mail sorting centre.
Plans for 2025
- €5.3 million to support delivery partners in expanding their electric fleets and charging infrastructure.
- €10.6 million in lease additions for our own fleet to further reduce emissions in our operations.
Renewable fuels
We are replacing petrol and diesel with cleaner alternatives like biogas and HVO100, cutting carbon emissions by up to 90% and reducing fossil fuel dependence. By the end of 2024, 77% of our large trucks ran on HVO100. Additionally, Spring procured 2.9 million litres of HVO100 and blended this into the European diesel fuel network. This supports our global CO₂e reduction efforts, particularly in middle-mile transport, connecting our facilities to last-mile delivery.
Key actions in 2024
- Using 7.3 million litres of HVO100 for our own trucks reduced 18 kilotonnes of CO2e, contributing to lowering average emissions to 128 grammes per kilometre.
- The out-of-tank solution, 2.9 million litres of HVO100, saved 8.3 kilotonnes of CO2e in 2024 achieving 90% lower emissions in the case the same amount of diesel was used. The surplus HVO100 purchased (0,55 million litres) will be used to further reduce our scope 3 emissions in 2025.
The actions focus on the downstream value chain, affecting customers and society. The time horizon for these specific actions is 2024 to 2025, but the use of renewal fuels in parts of our operations is ongoing.
Plans for 2025
- Invest €1.3 million to increase HVO100 use in large trucks (scope 1) from 77% to 80%, further cutting fleet carbon intensity.
- Invest €200,000 to expand HVO100 use in last-mile delivery, ensuring fossil fuel vehicles run on HVO100 wherever feasible to maximise environmental benefits.
More sustainable infrastructure
PostNL is committed to building and renovating sites with minimal environmental impact, aligning with our sustainability policy. Logistics sites have a significant footprint, so we follow BREEAM certification to ensure sustainability. All locations meet BREEAM standards, complying with regulations and minimising impact on Natura 2000 areas. We conduct nitrogen impact assessments and ecological studies for sorting centre projects, implementing recommendations to support biodiversity.
All 27 parcel sorting centres are BREEAM-NL certified. Of our eight newest centres, seven are rated “Outstanding” and one “Excellent.” Our head office, also BREEAM-NL certified, is the most sustainable listed building in the Netherlands. From €191 million allocated to sustainable buildings and energy efficiency, 75% was used for refinancing and the rest for new developments. Investments include €4 million in solar panels and heat pumps to replace traditional heating and cooling systems. Our sustainability initiatives extend across PostNL-owned and leased assets, influencing employees, communities, and society. With no set end date, sustainability remains a core focus.
Network efficiency
PostNL continuously seeks opportunities to optimise operations, improving efficiency and reducing GHG emissions. Enhancing network efficiency not only lowers costs but also improves customer convenience. In 2024, we expanded delivery options beyond home addresses, reducing the need for individual last-mile deliveries and minimising emissions from customer transport. Additionally, we discontinued Sunday deliveries due to low parcel volumes, improving operational efficiency.
While the specific reduction in GHG emissions from these measures is not yet quantifiable, we track quarterly progress by reporting on CO₂ efficiency and absolute CO2e emissions across our networks.
Key actions in 2024
- We expanded delivery options outside the home which reduces the need for individual last-mile deliveries, thus cutting emissions from customer transport.
- We discontinued Sunday deliveries to improve overall efficiency in our operations. Due to the lower volume of parcels on Sundays, delivery has become less efficient with fewer packages per route.
Plans for 2025
- We expect to optimise the use of our e-vehicles, replacing 1 million kilometres previously driven by non-electric vehicles with fully electric transport.
We are not able to quantify the forecast of the reduction of GHG emissions. The effects are measured on a quarterly basis by reporting on CO2e efficiency and absolute CO2e emissions per relevant network. The actions focus on the operations and downstream value chain, affecting employees, customers and consumers. These actions have an ongoing time horizon with no specific end date since this is an ongoing material topic for PostNL. PostNL has addressed all relevant sustainability matters through comprehensive action plans that effectively tackle the identified impacts, risks, and opportunities (IROs). These plans are designed to be robust yet adaptable, allowing for adjustments in response to innovations, new legislation, or significant market developments.
Targets
PostNL has committed to ambitious GHG emissions reduction targets that are aligned with the 1.5°C pathway of the Paris Agreement. for 2030 and 2040. These targets are not only designed to meet our climate goals but are also integrated into our broader environmental strategy, encompassing efforts to reduce air pollution and enhance circularity.
PostNL’s environmental targets are closely aligned with its overarching policy objectives, which focus on addressing climate change, pollution, and promoting the circular economy. The near-term and long-term targets provide a clear roadmap for achieving significant reductions in GHG emissions and waste, and address critical IROs associated with our operations.
Our climate targets directly address several key IROs:
- Contribution to global warming through direct and indirect GHG emissions (actual and potential): By implementing initiatives such as increasing the number of electric delivery vans and boosting the use of HVO100 in our network, we are reducing our carbon footprint while addressing the environmental impact of our operations.
- Cost and revenue risks from carbon taxes and competitive pressures: Our transition to low-carbon transportation and on-site renewable energy production positions us to mitigate rising costs associated with carbon pricing while enhancing our competitiveness and maintaining customer trust.
- Volume risks tied to regulatory changes: Meeting CO2e and circularity targets is central to retaining market access and ensuring compliance with evolving EU import restrictions, safeguarding our business volumes.
- Energy efficiency and sustainable energy production: By reducing energy demand from the grid and increasing on-site renewable energy production, we are not only cutting emissions but also contributing to the broader transition toward a sustainable energy mix in the Netherlands
The baseline value for our targets is 2021, selected according to SBTi guidelines. We will update the base year for our GHG emissions reduction targets every five years from 2030 onwards.
Baseline values
- Scope 1 emissions totalled 34,646 tCO2e in 2021.
- Scope 2 location-based 30,328 tCO2e in 2021.
- Scope 2 market-based 171 tCO2e in 2021
- Scope 3 emissions totalled 338,651 tCO2e in 2021.
Near-term 2030 targets (base year 2021)
- Reduce absolute scope 1 and 2 GHG emissions (gross in tonnes CO2e) by over 90% and absolute scope 3 GHG emissions by 45%. The target boundary includes land-related emissions and removals from bioenergy feedstock, working actively towards mitigating climate change by decreasing our direct and indirect carbon footprint.
- Renewable electricity: PostNL will continue to source 100% renewable electricity annually through 2030.
- PostNL commits to deliver all letters and parcels emission-free from the final sorting centre to the consumer or an alternative pick-up location (last-mile) in the Benelux by 2030, minimising environmental impacts, particularly in urban areas, in line with the policy's objective to mitigate pollution.
- PostNL uses the location-based method to measure its gross GHG emissions.
Long-term net-zero 2040 targets (base year 2021)
- Scope 1 and 2: PostNL commits to maintaining a minimum of 90% absolute GHG emissions reductions from 2030 through 2040.
- Scope 3: A 90% reduction in absolute scope 3 GHG emissions by 2040.
These are gross targets, meaning that they do not include GHG removals, carbon credits or avoided emissions. The progress of these targets can be found in the metrics section below. We will include the reporting of these new categories in our future Annual Reports to provide transparency about the progress against our new targets.
Methodology
PostNL has adopted a comprehensive approach to defining its climate-mitigation targets, considering a diverse range of developments in the environmental, societal, technological, market, and policy spheres. For identification, we use two climate-related scenarios from the International Energy Agency (IEA).
The 'Net Zero 2050' scenario was selected for its focus on deep decarbonisation, while the 'Stated Policies' scenario provided insights into the policy trajectory based on current national commitments. We also used internal operational data (e.g., energy consumption, fleet emissions) and external sources (such as climate models from the IPCC). Assumptions included the scalability of low-carbon technologies (e.g., electric vehicles) and the tightening of future regulations at the national and EU levels.
Since 2019, our targets have been validated by the Science-Based Targets initiative (SBTi), ensuring they are science-based and compliant with EU regulations. The SBTi framework ensures our targets are both ambitious and credible.
In setting our climate targets, PostNL has carefully considered future developments, including the introduction of emission-free zones, evolving customer preferences and demand, regulatory changes, and advancements in technology. These factors have guided our strategy, leading us to prioritise emission-free logistics while simultaneously leveraging biofuels for immediate GHG emissions reductions.
In 2023, we hosted a consultation with stakeholders, including business partners, financial organisations, NGOs, government bodies, and our employee representatives, to validate our material topics and gather feedback on our broader sustainability performance. Their input helped shape the direction of our climate targets, ensuring they reflect both market expectations and regulatory requirements.
The SBTi methodology has been used to ensure best practice guidance was followed to set these targets. The target setting method used was cross-sector and absolute, while intensity based targets were set. The target is measurable, and outcome- and time oriented. Annually, PostNL reports on the GHG emissions in the Annual Report. We measure in absolute emissions, tCO2e.
To achieve our GHG emission reduction targets, PostNL decarbonisation levers contribute to reductions across scope 1, scope 2, and scope 3 emissions.
Scope 1: Electrification of fleet
Our scope 1 emissions primarily stem from GHG emissions produced by our own fleet. The key decarbonisation lever here is the electrification of our fleet. By transitioning to electric vehicles (EVs), we expect to significantly reduce emissions from fuel combustion, and we aim for zero-emission delivery in the last-mile from the final sorting centre to the consumer or an alternative pick-up location by 2030. This action is expected to be sufficient to meet our scope 1 reduction targets by 2030.
Scope 2: Maintenance of net-zero emissions
We have reached our target to reduce 90% of our scope 2 emissions since PostNL’s scope 2 market based emissions are already reported as net zero, as we source 100% renewable electricity for our buildings and facilities. Our goal is to maintain this status by continuing to procure renewable energy for all our operations, ensuring no indirect emissions from purchased electricity.
Scope 3: Various decarbonisation levers
For scope 3 emissions, which include upstream and downstream activities across our supply chain, several decarbonisation levers contribute to our reduction targets for 2030 and 2040.
- Switching to renewable fuels
- Network efficiency
- Sustainable infrastructure.
Each of these levers is essential for reducing emissions across our value chain, ensuring we remain on track to achieve our climate targets. See the Strategy section earlier in this chapter for more information.
Our targets are embedded within a comprehensive framework of sustainable development, contributing to the United Nations Sustainable Development Goals (SDGs). Beyond our commitment to reducing emissions, we actively address other vital sustainability dimensions, including biodiversity, waste reduction, and enhancing urban air quality.
Aligned with the recommendations of the Task Force on Climate-related Financial Disclosures (TCFD), we have undertaken an assessment of climate-related risks, focusing on potential business and financial impacts. Each identified risk was thoroughly evaluated in terms of likelihood and the associated effort required to manage it. Simultaneously, we identified opportunities arising from developments such as the transition to renewable energy and the adoption of electric vehicles.
By taking this approach, we ensure our targets remain not only ambitious but also closely aligned with our strategic priorities for growth and resilience, positioning PostNL to deliver long-term value while contributing positively to society.
Target setting
The inclusions and exclusions from the GHG protocol emission targets are in line with SBTi guidance and are driven by the level of relevance for our business and the influence PostNL has on reductions in each category. Consistency is ensured through annual evaluation of applicability of emission categories to business operations. This is then compared to emission categories included in scope 1-3 targets.
We will include the reporting of these new categories in future Annual Reports to provide transparency about the progress against our new targets. 100% of our scope 1 & 2 targets are covered by our scope 1 emissions.
The generation of direct and indirect CO2e emissions constitutes PostNL’s primary source of greenhouse gas (GHG) emissions. Additionally, we account for other GHGs, such as methane (CH4) and nitrous oxide (N2O), and measure our climate impact in CO2 equivalents, ensuring all GHGs are encompassed within our targets.
To establish a reliable baseline for tracking progress, we employ a robust methodology combining internal operational data—such as energy consumption and fleet emissions—with external sources, including climate models. This approach ensures our measurements reflect external factors such as regulatory developments or technological advancements, providing a transparent and accurate depiction of our progress toward achieving our climate targets.
The baseline year and value, based on 2021, will remain unchanged unless there is a significant shift in our targets or reporting boundary. In such cases, we will explain how these changes impact the target, its achievement, and progress presentation, in line with best practices validated by the SBTi.
From 2030 onwards, we intend to update our baseline year at five-year intervals. Until then, the 2021 baseline remains the foundation for tracking progress towards our near-term targets for 2030.
When disclosing past progress toward climate targets, PostNL will ensure consistency with current reporting standards, including providing explanations for any differences in methodology or target boundaries.
New technologies
- Energy-efficient buildings: Investing in energy-efficient infrastructure, such as smart sorting centres with better insulation, LED lighting, and automated systems for heating and cooling. Installing solar panels at depots and offices further enhances energy self-sufficiency.
- Route optimisation technology: Using advanced algorithms and AI-driven route planning can minimise the number of kilometres driven by optimising delivery routes, which would directly reduce fuel consumption and emissions. This can also help avoid unnecessary trips and improve overall network efficiency.
- Scaling up our out-of-home solutions: We are increasing the number of parcel lockers located around the Netherlands, which gives consumers the option to send and collect parcels when it is convenient for them.
- Electric fleet charging management: Implementing smart charging infrastructure to manage when and how vehicles are charged can reduce energy demand during peak hours and ensure vehicles are charged using renewable energy, where possible.
While we continue to make progress on decarbonisation of our fleet, we foresee future bottlenecks, as grid operators are increasingly denying permission to expand connections in depots and other buildings because of growing congestion on the electricity grid. This could make our transition to emission-free delivery more complex.
Decarbonisation levers and their contribution to our GHG reduction targets
The estimated contribution of each decarbonisation lever is based on the distribution of emissions in our 2021 base year and may evolve over time as technology and market conditions change.
Scope 1:
- 55% reduction through fleet electrification
- 40% reduction via renewable fuels
- 5% reduction through network efficiency improvements
Scope 2:
- 100% reduction through energy efficiency and using Guarantees of Origin as a market based instrument
Scope 3:
- 63% reduction through a combination of electrification, renewable fuels, and network efficiency
- 30% reduction via sustainable and circular procurement & waste management
- The remaining 7% will rely on innovation to achieve additional emission reductions
The balance between electrification and renewable fuels will shift over time, depending on technological advancements. operational feasibility and financial position of PostNL.
Resources in relation to climate change
PostNL’s ability to implement its sustainability actions, including adjustments to supply and demand and significant investments such as R&D, is highly dependent on the availability and allocation of resources.
Green Bond programme
A key enabler of our sustainability strategy is our Green Bond programme, which involved issuing €300 million in Green Bonds to finance green projects in alignment with the four pillars of the Green Bond Principles 2018 (GBP), administered by the International Capital Market Association (ICMA). More information about the Green Bond can be found in the Strategy section, specifically the Green Bond paragraph. This initiative ensures the necessary investments to support our sustainability goals, including emission-free deliveries and other environmental projects.
Sustainability-Linked Financing Framework
The Sustainability-Linked Financing Framework, published in 2024, underscores our commitment to sustainability and accelerates our transition towards becoming a truly sustainable e-commerce logistics service provider. This framework lays the foundation for a Sustainability-Linked Financing programme, designed to provide the financial resources required to achieve PostNL’s strategic objectives, including our emission-free delivery ambitions.
While we are well-positioned to pursue our sustainability targets, access to affordable capital and maintaining sufficient financial resources remain critical. Any increase in financing costs or reduced access to capital could impact the pace of implementing the technologies and infrastructure essential for achieving our sustainability goals. We actively monitor our financial position and market conditions to ensure we can fully execute our commitments and maintain our progress towards becoming a sustainable logistics provider.
For more information on the Sustainability-Linked Financing Framework, please see the Our strategy and business model section in the General disclosures.
Metrics
CO2 efficiency and emission-free last-mile delivery
Since 2019, we steer on two KPIs to monitor our progress in reducing our environmental impact, CO2 efficiency of our own operations and emission-free delivery of parcels and mail in the Benelux, by ourselves and our delivery partners.
Making progress on these two metrics cover the main elements of our business to achieve our long-term formal absolute and relative CO2e targets, more information about our targets can be found in the Targets chapter earlier in this section.
Both CO2 efficiency and emission-free last-mile delivery are relevant for the material topics climate change mitigation and energy. Refer to the Data extrapolation table in the Appendices for information regarding extrapolation of lacking or missing data.
CO2 efficiency
We measure our CO2 efficiency as the total CO2e emissions from our own operations, both fleet and buildings, expressed per kilometre transported. The total transported kilometres include the kilometres of all our networks, both motorised and unmotorised (foot and bike). We monitor the progress on our targets through a comparison with the annual target setting and steer actively on our progress.
Emission-free last-mile delivery
In 2018, we introduced a target to deliver emission-free from the final sorting centre to the consumer or an alternative pick-up location by 2030, which we report as the share of emission-free kilometres compared to the total kilometres transported. This includes kilometres from our own operations and of our delivery partners and includes the collection of mail and parcels with small trucks and vans and other light vehicles.
PostNL CO2 efficiency and emission-free last-mile delivery as indicated
2023 - 2024
| Year ended at 31 December | 2023 | 2024 |
|---|---|---|
| CO2 efficiency (scope 1 and 2 emissions in grammes CO2e per km) | 136 | 128 |
| Share of emission-free delivery of mail and parcels in the last-mile | 24% | 28% |
Our CO2 efficiency was 128 grammes per kilometre in 2024 (2023: 136), which is behind our target for the year (126 grammes per kilometre). The share of emission-free last-mile delivery of mail and parcels was 28% in 2024 (2023: 24%). More information about our CO2 efficiency and emission-free delivery can be found on pages 50-51 in the Environmental value chapter.
Carbon footprint
Scope 1
Scope 1 CO2e emissions encompass the consumption of gas and heating fuel in buildings, as well as the fuel use of small trucks, large trucks, and motorcycles.
- Heating fuel usage is based on invoices, while gas consumption is derived from a combination of actual metered data and extrapolated estimates. The latter is based on average gas usage per square metre for entities where primary data is unavailable, such as rented properties with an “all-in” tariff.
- Fuel usage is always based on actual data from the provider. For each energy and fuel type, the consumption amount is multiplied by the corresponding tank-to-wheel CO2e conversion factor from CO2emissiefactoren.nl.
- Fugitive emissions refer to both intentional and unintentional releases of gases or vapours from pressurised equipment due to leaks and irregular discharges. These emissions are particularly significant because they often involve high global warming potential gases, such as methane and hydrofluorocarbons. PostNL’s sources of fugitive emissions include refrigeration installations in buildings, air conditioning in vehicles, and refrigerated transport. CO2e emissions are calculated by multiplying the amount of refrigerant (in kilogrammes) or the number of vehicles by the respective CO2e factor for the refrigerant.
Scope 2
Scope 2 CO2e emissions consist of electricity used in buildings as well as vehicles and district heating. For electricity, we report location-based and market-based emissions.
- Location-based emissions are the amount of electricity used multiplied with the appropriate grid factor of the country where the building is situated. The amount of district heating in megajoules is multiplied with the appropriate CO2conversion factor from CO2emissiefactoren.nl.
- Market-based emissions are zero by making use of Guarantees of Origin which is electricity produced from Dutch windmill parks in the North Sea. For district heating, which is only used in a limited number of buildings, the market-based factor is equal to the location-based factor.
Scope 3
As per below we provide an overview of our scope 3 CO2e emissions, indicating whether relevant for PostNL.
PostNL Overview scope 3 categories
| Description | Consideration | Conclusion |
|---|---|---|
| Purchased goods and services | Material, based on our spend | Included |
| Optional sub-category: cloud computing and data centre services | Not material to separately disclose, included in the purchased goods and services category | Excluded |
| Capital goods | Material, based on our spend | Included |
| Fuel and energy-related activities | Material, as this is the production and distribution of our main energy sources (fuel, electricity, gas) | Included |
| Upstream transportation and distribution | Material, significant part of our logistics services are outsourced | Included |
| Waste generated in operations | Material, waste is part of our environmental reduction programmes | Included |
| Business travel | Material, business travel by air is part of our environmental reduction programmes | Included |
| Employee commuting | Material, employee commuting is part of our environmental reduction programmes | Included |
| Upstream leased assets | Material, company cars are part of our environmental reduction programmes | Included |
| Downstream transportation and distribution | Not applicable, outside of our value chain boundary as explained in the Our operating context chapter | Excluded |
| Processing of sold products | Not applicable, we do not manufacture or recycle sold products | Excluded |
| Use of sold products | Not applicable, outside of our value chain boundary as explained in the Our operating context chapter | Excluded |
| End of life treatment of sold products | Not applicable, outside of our value chain boundary as explained in the Our operating context chapter | Excluded |
| Downstream leased assets | Not applicable, we do not have downstream leased assets | Excluded |
| Franchised investments | Not material, this category has been deemed not significant based on the percentage of total emissions | Excluded |
Reporting boundary Scope 3
The reporting boundary for our scope 3 emissions is the same as it is for the rest of our sustainability statement, as explained in the general disclosures, section Basis for preparation of the General disclosures.
As per below we describe the method for calculating CO2e emissions and whether primary data has been used for each of the relevant scope 3 GHG categories:
- Purchased goods and services: Our spend databases provide a breakdown into various types of goods and services. Per category the amount of spend is multiplied by an estimated factor of CO2e per Euro. This estimate has been made by CE Delft, which store these estimates in their database called Exiobase. This can be classified fully as secondary data (0% primary data). Cloud computing and data centre services is not material for PostNL and therefore not separately disclosed, but included in this category.
- Capital goods: Our spend databases provide the spend for buildings and machinery, subsequently in a similar manner as for the purchased goods and services the estimate is calculated. This can be classified fully as secondary data (0% primary data).
- Fuel and energy related services: This category can be divided into three subcategories: Upstream emissions of purchased fuels (scope 1), upstream emissions of purchased energy (scope 2), and upstream emissions from transport and distribution losses (scope 2). For the first two categories, we have used the primary data from our own fuel and energy usage (scope 1 and 2) and multiplied this with the corresponding Well-to-Tank factors from CO2emissiefactoren.nl. For the transport and distribution losses – which are the emissions associated with the energy lost while transporting electricity across the grid – we have used the national percentage of distribution losses for the Dutch power grid to determine the T&D losses attributable to PostNL (source: Dutch Central Bureau of Statistics - CBS). Since more than 95% of our electricity use takes place in the Netherlands, we have extrapolated this distribution loss percentage to our total electricity use. The data used for the calculations for all three categories in the Netherlands can be classified for 97% as primary data.
- Upstream transportation and distribution: These are emissions caused by our delivery partners. For domestic emissions within the Netherlands and Belgium, the number of kilometres recorded by our route planning systems is multiplied by the average fuel consumption of vehicles comparable to those used by our delivery partners, such as small and large trucks. The resulting estimated fuel consumption in litres of diesel or electricity is then converted into CO2e emissions using the Well-to-Wheel conversion factors provided by CO2emissiefactoren.nl. For international transport by road, air, and sea, emissions are estimated based on tonne-kilometres. These are calculated by combining the weight and distance of parcels and letters transported, as reported by our delivery partners. The tonne-kilometres are then multiplied by the relevant CO₂e conversion factors: for airfreight and sea freight from CO2emissiefactoren.nl, and for large trucks from DEFRA. This can be classified fully as secundary data (0% primary data).
- Waste generated in operations: The waste generated by our operations is tracked and reported by our waste disposal partner in the Netherlands, who provides detailed insights into the amount of waste (in kilogrammes) categorised by type. The report also includes the CO2e emissions associated with the waste disposal and recycling processes. This data pertains to our domestic Dutch entities, and can be classified for 92% as primary data. For our international entities, we estimate emissions by applying the average actual CO2e emissions per FTE to the number of FTEs within these foreign entities.
- Business travel: For PostNL, this category consists solely of business travel by air from employees. Other forms of business travel are listed under employee commuting or upstream leased assets (company cars). We obtain passenger kilometres for each flight from our travel agent. A split is made for short-, medium- and long-haul flights. The consolidated total is multiplied with the appropriate Well-to-Wheel CO2e conversion factor provided by DEFRA. This can be classified as 98% primary data. For our international entities, we estimate emissions by applying the average actual CO2e emissions per FTE to the number of FTEs within these foreign entities.
- Employee commuting: The calculation of CO2e emissions is based on the distance between employees’ home and work addresses. It is assumed that employees residing within 5 kilometres of their workplace travel by foot or bike, resulting in no emissions. For those employees reimbursed for travel via Dutch public transport, the total kilometres travelled are multiplied by a standard CO2e conversion factor. Employees who live more than 5 kilometres away and do not make use of public transport or hold a company car (listed under upstream assets) are considered to commute by private car. The combined kilometres for these employees are calculated using the generic Dutch CO2e conversion factor. Adjustments are made across all travel categories to account for absences due to sickness or holidays. For entities located outside the Netherlands, figures are extrapolated based on the average actual kilometres travelled per FTE for private cars and public transport. Emission factors are sourced from CO2emissiefactoren.nl and are applied on a Well-to-Wheel basis. This can be classified fully as secundary data (0% primary data).
- Upstream leased assets: This category consists of the emissions of employees using company cars, which are company-owned or leased vehicles at the disposal of an employee for commuting and business travel. Data on fuel use is provided by the vehicle lease company. The amount of fuel per fuel type is multiplied by the Well-to-Wheel CO2e conversion factor of CO2emissiefactoren.nl. This can be classified for 98% as primary data. For our international entities, we estimate emissions by applying the average actual CO2e emissions per FTE to the number of FTEs within these foreign entities.
In line with the outlined classifications, 8% of our scope 3 GHG emissions for the reporting period have been calculated using primary data.
GHG emission intensity
The GHG emissions intensity is the total GHG emissions per net revenue. The total GHG emissions is the sum of scope 1, scope 2 and scope 3 gross emissions. The net revenue in the calculation is aligned with the revenue from contracts with customers presented in the Consolidated statement of profit or loss, within our Financial Statements.
PostNL Carbon footprint in tonnes CO2e
2023 - 2024
| Retrospective | Milestones and target years | |||||||
|---|---|---|---|---|---|---|---|---|
| Year ended at 31 December | Base year 2021 | 2023 | 2024 | change | 2025 | 2030 | 2040 | Annual % target year 2025 / Base year 2021 |
| Scope 1 GHG emissions | 34,646 | 22,459 | 21,339 | (5%) | 18,073 | 3,465 | 3,465 | 12% |
| Scope 2 GHG emissions | ||||||||
| Gross location-based scope 2 | 30,328 | 27,176 | 18,857 | (31%) | 17,910 | no target | no target | 10% |
| Gross market-based scope 2 | 171 | 189 | 80 | (58%) | 86 | 17 | 17 | 12% |
| Scope 3 GHG emissions | 338,651 | 290,645 | 266,336 | (8%) | 251,261 | 186,238 | 33,865 | 6% |
| 1. Purchased goods & services | 58,684 | 50,502 | 47,948 | (5%) | ||||
| 2. Capital goods | 21,892 | 20,300 | 13,541 | (33%) | ||||
| 3. Fuel & energy related activities | 11,621 | 10,834 | 10,580 | (2%) | ||||
| 4. Upstream transportation & distribution | 213,110 | 182,648 | 168,350 | (8%) | ||||
| 5. Waste generated in operations | 7,343 | 6,662 | 7,200 | 8% | ||||
| 6. Business travel (by air) | 169 | 278 | 460 | 65% | ||||
| 7. Employee commuting | 22,958 | 16,321 | 14,918 | (9%) | ||||
| 8. Upstream leased assets (company cars) | 2,876 | 3,101 | 3,339 | 8% | ||||
| Total GHG emissions | ||||||||
| Total gross location-based | 403,625 | 340,279 | 306,531 | (10%) | 35,984 | no target | no target | 23% |
| Total gross market-based | 373,468 | 313,293 | 287,755 | (8%) | 269,420 | 189,719 | 37,347 | 7% |
| Total gross location-based per net revenue (tCO2e per million Euro) | 116.45 | 107.51 | 94.26 | (12%) | 11.06 | 23% | ||
| Total gross market-based per net revenue (tCO2e per million Euro) | 107.75 | 98.98 | 88.48 | (11%) | 82.84 | 6% | ||
Scope 1
Our gross scope 1 emissions fell by 1,120 tonnes (5%) in 2024 compared to 2023, driven by lower emissions across all transport activities. Since 2020, we have sourced natural gas through market-based Guarantees of Origin for biogas. Nominal gas usage declined in 2024 due to various business factors, detailed in the Energy efficiency of buildings section in this chapter. Key contributors to our scope 1 reduction included fewer kilometres driven, increased use of HVO100 over diesel, and more kilometres covered by small electric trucks. Fugitive emissions from coolant evaporation in buildings and vehicles are included in scope 1, amounting to 1,176 tonnes.
Scope 2
Our gross location based scope 2 CO2e emissions are mainly comprised of electricity use and for a small part consists of district heating. Nominal electricity consumption decreased in 2024 to 66 million kWh (2023: 67 million kWh). Supporting our ongoing transition to an electric vehicle fleet, we expanded our charging infrastructure during 2024. The rise in kilometres driven by electric vehicles contributed to higher electricity usage for our fleet; however, this was offset by a reduction in electricity consumption from our buildings. Our location-based scope 2 emissions totalled 18,857 tCO2e in 2024 (2023: 27,176 tCO₂e). Lower emissions are a result of less electricity use but also the increased electricity generation from our solar panels.
Our gross market-based scope 2 CO2e emissions decreased to 80 tonnes in 2024 (2023: 189). This reduction is solely due to district heating, which is used by only a few buildings, one of which was vacated. We stimulate the use of electricity from green and renewable sources in our buildings, and use the market-based instrument of purchasing Guarantees of Origin to ensure our electricity consumption is based on renewable energy. The percentage of contractual instruments for electricity consumption is 100%. In addition to electricity, PostNL operates a small number of facilities that utilise district heating supplied by a local heating grid.
Scope 3
Our total gross scope 3 emissions fell by 8% in 2024, a reduction of 24,309 tonnes CO2e. Most emissions came from outsourced road and air transport, purchased goods & services, capital goods, and employee commuting. Austerity measures led to lower spending, reducing emissions from purchased goods & services, while decreased investment in buildings and equipment lowered emissions from capital goods.
Employee commuting emissions dropped by 1,403 tonnes CO2e, driven by headcount reductions and higher absenteeism, resulting in fewer commutes. International truck transport benefited from the market-based “HVO100 out of the tank” solution, cutting 8,319 tonnes of gross CO2e. This intervention ensures only PostNL can claim the emissions reduction. Business air travel emissions rose from 278 to 460 tonnes CO2e due to Cross Border Solutions’ expansion, requiring more international meetings with customers and staff.
Outsourced transport
The total emissions from outsourced transport decreased by 14,298 tonnes CO2e to 168,350 tonnes CO2e in 2024 (2023: 182,648 tonnes CO2e). Several factors contributed to the decrease of around 8% in 2024. Examples include fewer kilometres driven as a result of volume developments and network efficiency, especially for our large truck transport and time-critical network, as well as several data quality improvements and growing sustainability measures at delivery partners related to renewable fuels and fleet electrification.
CO2 credits
In 2022 and 2023, PostNL compensated all gross CO2e emissions within the scope of its Annual Report and validated science-based targets (approved by the SBTi in 2019) through CO2 offset credits. Prior to 2022, carbon offsets were applied selectively to scope 3 GHG categories where reduction measures were not yet feasible. For 2023, PostNL utilised CO2 offset credits from certified projects under the Verified Carbon Standard (VCS) and Gold Standard, managed by the non-profit organisation Verra, achieving net GHG emissions of 0 tonnes across scopes 1, 2, and 3. Following an internal review in 2023, PostNL decided to discontinue the use of carbon offsets for all reported emissions as of 1 January 2024. Instead, the focus has shifted to more impactful carbon reduction measures within operations and the value chain, including investments in "HVO100 out the tank" insetting as a market-based instrument.
Science Based Target initiative-endorsed targets
PostNL is committed to achieving CO2e reduction targets aligned with the 1.5°C trajectory of the Paris Climate Agreement, as endorsed by the SBTi. These targets include both near-term goals for 2030 and a long-term net-zero objective for 2040. More information about our targets can be found in the Targets paragraph earlier in this section.
*The target boundaries include land-related emissions and removals from bioenergy feedstocks.
Near-term 2030 targets
- Scope 1 and 2: PostNL aims to reduce absolute GHG emissions by 90% by 2030, based on a 2021 baseline*
- Renewable electricity: PostNL will continue to source 100% renewable electricity annually through 2030
- Scope 3: A 45% reduction in absolute scope 3 GHG emissions by 2030, from a 2021 base year.
Long-term net-zero 2040 targets
- Scope 1 and 2: PostNL commits to maintaining a minimum of 90% absolute GHG emissions reductions from 2030 through 2040, based on a 2021 baseline*
- Scope 3: A 90% reduction in absolute scope 3 GHG emissions by 2040, from a 2021 base year.
GHG emission intensity
Our GHG emissions intensity (total market based GHG emissions per euro million net revenue) in 2024 was 88.48 (2023: 98.98).
Biogenic emissions
Biogenic emissions are generated through the combustion or decomposition of biomass-based materials, primarily arising from the use of renewable fuels. These emissions are calculated by multiplying the volume of each fuel type used by the tank-to-wheel CO₂-equivalent (CO₂e) emission factors, which are derived from their fossil fuel equivalents: diesel, CNG, and LNG.
Our scope 1 biogenic emissions arise from the use of HVO100 renewable diesel, bio-LNG, and bio-CNG. It also includes the impact of using Guarantees of Origin for our gas usage in buildings. This consists of biomethane from fermentation. Our scope 3 biogenic emissions result from the market-based instrument for HVO100 outside the tank, applied by our Cross Border Solutions division. Through this mechanism, PostNL purchases HVO100, which is then integrated into the existing fuel market and used by third parties—while only PostNL can claim the associated CO₂e reductions.
PostNL Biogenic emissions in tonnes CO2e
2023 - 2024
| Year ended at 31 December | 2023 | 2024 |
|---|---|---|
| Scope 1 biogenic emissions | ||
| Biogenic CO2e emissions biofuel | 19,254 | 18,117 |
| Biogenic CO2e emissions biogas | 8,933 | 6,598 |
| Scope 3 biogenic emissions | ||
| Biogenic CO2e emissions biofuel | 0 | 6,727 |
| Total biogenic CO2e emissions | 28,187 | 31,442 |
Internal carbon pricing
At PostNL, we have implemented an internal carbon pricing (ICP) scheme to support our emission-reduction strategy and guide decision-making around carbon impacts. Since 2019, we have used this measure to increase awareness within the organisation about the value of carbon and to encourage investments that have a positive climate impact.
Type of internal carbon pricing scheme
We use shadow pricing in our investment decision-making processes, applying a carbon price when evaluating the environmental and financial viability of capital expenditure (capex). The purpose of this scheme is to ensure carbon considerations are incorporated into our business cases and to promote low-carbon initiatives.
Scope of application
The pricing scheme is applied across various activities within PostNL, focusing on logistics operations and energy consumption. It covers our direct operations (scope 1 emissions), as well as electricity-related emissions (scope 2). Although our scope 2 emissions are now neutralised through the use of renewable energy, the scheme still plays a role in guiding our wider sustainability strategy.
Carbon prices and assumptions
PostNL initially set the carbon price at €50 per metric tonne of CO2e in 2019, raising it to €100 per metric tonne in 2022. This price helps to drive decisions around investments in energy efficiency, fleet electrification, and other emission-reducing initiatives. Our carbon price was determined by performing a peer review and referencing publicly available data such as the World Bank Group's carbon pricing dashboard and the EU ETS (Emissions Trading System) carbon price. The carbon price was set in the top bracket of what is commonly used. The internal carbon price applied by PostNL is an estimate and will be periodically reviewed against market developments. Currently, our reporting is limited to the submitted cases during the reporting year. For each case only the GHG emissions reduction within the reporting year is taken into account. In 2025, we will further evaluate the scheme's future and our methodology.
Biogenic emissions
The reduction of biogenic emissions in scope 1 is a result of decreased HVO100 and biogas consumption, partially due to cost-saving measures and a focus on electrification as a more sustainable solution for emission reduction. On the other hand, biogenic emissions in scope 3 have increased with the introduction of our 'HVO100 out-of-tank solution'.
Internal carbon pricing
PostNL’s internal carbon pricing scheme encompasses scope 1 and scope 2 location-based emissions, including direct emissions from our fleet and facilities. In 2024, direct scope 1 and 2 emissions totalled 24,010 tonnes CO2e. Through targeted investments, a combined capex-related reduction of 125 tonnes CO2e was achieved, representing 0.3% of overall scope 1 and 2 CO2e emissions.
Integrating climate-related considerations into decision-making is fundamental to delivering on our emission reduction strategy. Since its introduction, the internal carbon pricing scheme has been instrumental in driving climate-positive investments, ensuring PostNL remains aligned with its long-term sustainability commitments. We plan to further evaluate the scheme in 2025.
Energy
Actions
Energy efficiency
Minimising the environmental impact of our sorting centres is a priority. To this end, we are installing energy-efficient LED lighting and optimising energy consumption. Additionally, our BREEAM certifications and energy monitoring processes provide a robust framework for reducing our climate impact.
Key actions
- We are generating 50% of the electricity for our parcel sorting centres ourselves via solar panels on our roofs.
- We purchase with Guarantees of Origin, which provides assurance that we only use renewable electricity (scope 2) from the Netherlands and renewable gas (scope 1) from Europe.
- We have installed a battery system for locally generated energy during the day, which is used to power sorting machines and charging electric vans during the evening /night. This also helps alleviate congestion on the energy grid.
- In 2025, we will add additional charging points at our locations (capex €2.4 million).
Network efficiency
For more information on our actions to improve network efficiency, please refer to the corresponding section in the Our performance of Climate change.
Targets
The targets for energy efficiency are related to the scope 1 and scope 2 targets and can be found in the Our performance of Climate change.
Metrics
Both CO2 efficiency and emission-free last-mile delivery are relevant to the material topics of climate change mitigation and energy. To avoid repetition, we address the metric under the Our performance of Climate change.
Energy consumption
PostNL operates in a high climate-impact sector, making energy efficiency a key priority. More information can be found in the General disclosures, section Our strategy and business model.
Energy consumption of our buildings
The energy consumption of our buildings relates to logistics centres and office buildings. The energy consumption associated with our own operations concerns both owned and leased buildings and fleet. Outsourced activities are not in scope of this disclosure requirement.
The majority of our buildings use renewable gas and electricity. Where available, we use metered actual data. In cases where our entities have agreements with landlords that include energy costs, PostNL operates merely as a tenant and does not have access to specific energy consumption data. In such instances, the energy cost is fixed and inseparable from the overall rental price. To estimate electricity and gas usage, we apply scaling based on the square meters (m²) per building. The same method applies for buildings in other countries where specific energy data on gas and electricity usage was unavailable. Refer to the Data extrapolation table in the Appendices for information regarding extrapolation of lacking or missing data.
We ensure that the electricity and gas we use are backed by Guarantees of Origin, which are 100% renewable. As a result, we do not report on nuclear energy sources. For more detailed information on Guarantees of Origin, please refer to the Climate Change metrics earlier in this report.
PostNL utilises non-renewable energy sources for heating fuel as well as district heating. The actual consumption figures are derived from supplier-provided reports.
Energy consumption from fleet
We report on the energy consumption of our fleet, which includes small trucks and vans, large trucks, and scooters. Fuel usage data, provided by our suppliers, reflects the actual litres of fuel consumed. Electricity used by our electric fleet is classified as renewable, supported by Guarantees of Origin.
For vehicles operating on HVO100 renewable diesel, the energy is reported as biofuel energy, while those using bio-CNG or bio-LNG are categorised under biogas energy. Vehicles using fossil diesel, LPG, or gasoline are reported as energy derived from petroleum products, and those running on fossil CNG or LNG are reported as energy derived from natural gas.
Note that standard publicly available Dutch conversion factors "Nederlandse lijst van energiedragers" are applied to convert primary activity data from both buildings and vehicles into energy consumption figures in MWh.
PostNL Energy consumption as indicated
2023 - 2024
| Year ended at 31 December | 2023 | 2024 |
|---|---|---|
| Fuel consumption from coal and coal products (MWh) | - | - |
| Fuel consumption from crude oil and petroleum products (MWh) | 62,281 | 55,445 |
| Fuel consumption from natural gas (MWh) | 11,308 | 12,223 |
| Fuel consumption from other fossil sources (MWh) | 309 | 176 |
| Consumption of purchased of acquired electricity, heat, steam and cooling from fossil sources (MWh) | 1,629 | 1,039 |
| Total fossil energy consumption (MWh) | 75,527 | 68,883 |
| Share of fossil sources in total energy consumption (%) | 28% | 29% |
| Consumption from nuclear sources (MWh) | - | - |
| Share of nuclear sources in total energy consumption (%) | 0% | 0% |
| Fuel consumption for renewable sources, including biomass (MWh) | 114,683 | 92,940 |
| Consumption of purchased or acquired electricity, heat, steam, and cooling from renewable sources (MWh) | 70,483 | 69,273 |
| The consumption of self-generated non-fuel renewable energy (MWh) | 5,392 | 5,165 |
| Total renewable energy consumption (MWh) (calculated as the sum of lines 8 to 10) | 190,558 | 167,379 |
| Share of renewable sources in total energy consumption (%) | 72% | 71% |
| Total energy consumption (MWh) | 266,085 | 236,262 |
Compared to 2023, our energy consumption from crude oil and petroleum products decreased in 2024, driven by the electrification of our fleet and the increased use of renewable fuels. In 2024, our electricity consumption increased compared to previous years; however, we continue to face challenges in optimising the use of our electric vehicles. To address this, a dynamic charging schedule was introduced at the end of the year.
Additionally, our charging infrastructure remains constrained by grid congestion in the Netherlands. Furthermore, the transition from diesel to HVO100 biofuel slowed in the second half of the year due to necessary cost-saving measures. To support our sustainability goals, we purchase Guarantees of Origin for renewable biomethane from fermentation installations. As a result, gas consumption is reported under "consumption of purchased or acquired electricity, heat, steam, and cooling from renewable sources."
Our large sorting centres are BREEAM-NL certified, a standard that promotes energy efficiency and low environmental impact. The use of non-renewable energy sources, such as district heating and heating oil, is limited to a small number of sites. In 2024 8,064 MWh of electricity was self generated from solar panels, of which 5,165 MWh was self-consumed accounting for approximately 7% of our total electricity consumption.
Energy consumption intensity
The total energy consumption, measured in megawatt hours (MWh) for buildings and fleet combined, is calculated relative to the total net revenue of all PostNL entities within the defined scope. The net revenue in the calculation is aligned with the revenue from contracts with customers presented in the Consolidated statement of profit or loss, within our Financial Statements.
PostNL Energy consumption intensity as indicated
2023 - 2024
| Year ended at 31 December | 2023 | 2024 | change |
|---|---|---|---|
| Total energy per net revenue (MWh per million Euro) | 84 | 73 | (14%) |
Energy use decreased in 2024 compared to 2023, while revenue increased by approximately €87 million. This had a favourable impact on this indicator.